John Wiseman
CrowdStrike's Impact on Aviation
Just after midnight Eastern Time on July 19, 2024, the enterprise cybersecurity company CrowdStrike YOLOed a software update to millions of Windows machines. Or as they put it:
On July 19, 2024 at 04:09 UTC, as part of ongoing operations, CrowdStrike released a sensor configuration update to Windows systems.
That sensor configuration update caused the largest IT outage in history.

Overnight, about 8.5 million computers blue screened, affecting hospitals, banks, 911 systems–as the New York Times put it, “It is more apt to ask what was not affected.” The answer is Linux, Macs, and phones.
The outage highlighted a different kind of digital divide. On one side, gmail, Facebook, and Twitter kept running, letting us post photos of blue screens located on the other side: the Windows machines responsible for actually doing things in the world like making appointments, opening accounts, and dispatching police.
They also run airlines.
Here’s a visualization of the chaos that CrowdStrike caused for airlines from the New York Times:
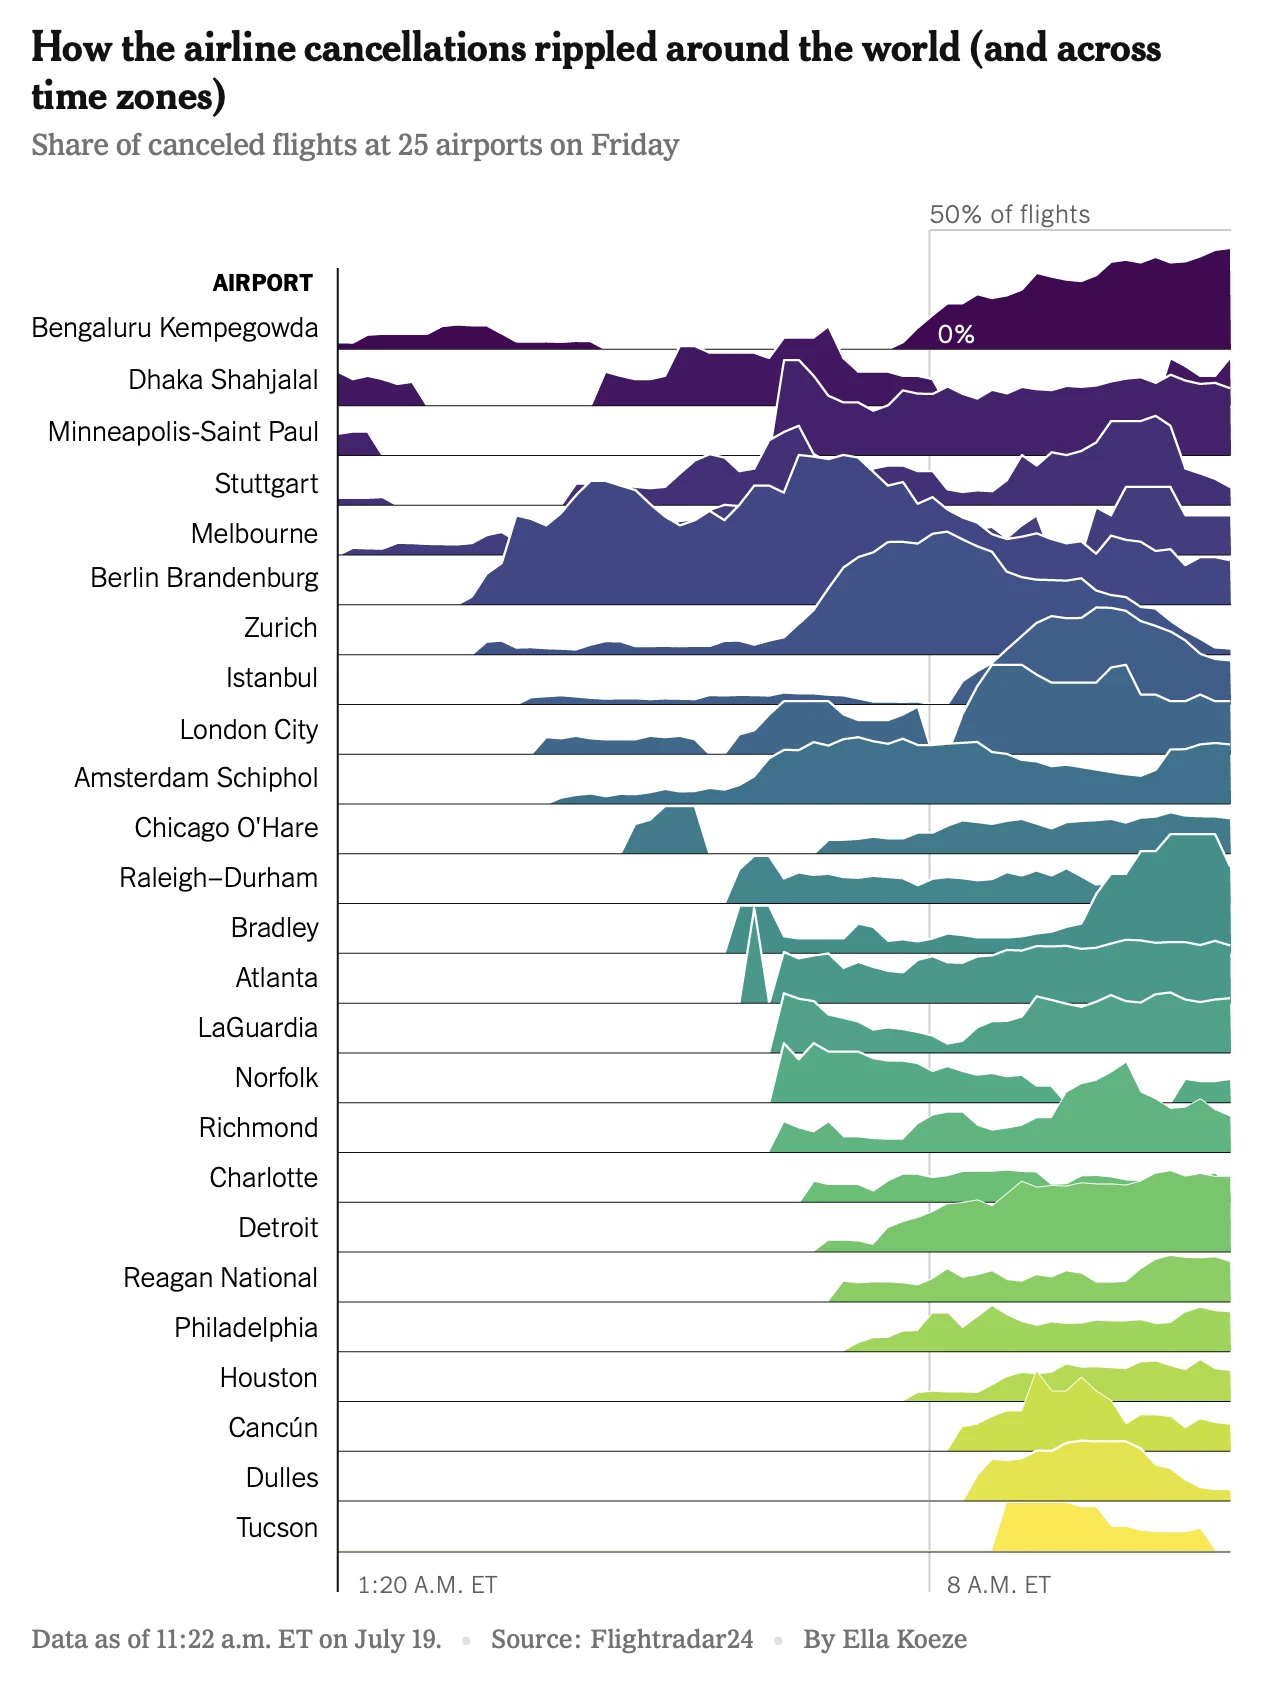
Airline cancellations is a good metric, but I want to look directly at air traffic: How many planes were in the air? How many planes should have been in the air?
At about noon UTC, 8 hours after the CrowdStrike update hit, someone posted a video to Twitter that they made with FlightRadar24 showing air traffic over the United States. It was described as a 12-hour timelapse of American Airlines, Delta, and United plane traffic that showed the nationwide ground stop of the three airlines due to CrowdStrike.
Here’s the video:
It’s not a good visualization of the impact because there’s no basis for comparison. It clearly shows fewer planes flying at night, but that happens every day. Was that night different from any other night? There’s no way to tell. In Bellingcat’s “OSHIT: Seven Deadly Sins of Bad Open Source Research”, sin #4 is “Lacking Context for Occurrences, Common or Otherwise”. In this post I’ll show the effects CrowdStrike had on air traffic, with enough context to make the significance clear.
Impact on U.S. Aviation
CrowdStrike hit on July 19. This chart shows the number of aircraft that took off in the United States, hour by hour, on that day. It also shows the same numbers for July 12, the previous Friday. The same day one week previously seems to be a good basis for comparison–both days are Fridays, and there aren’t any major holidays on either day. I also plotted the stats for July 18, the day before CrowdStrike, but it was very similar so I’ll continue to compare to the previous week.
Note that the chart is for all of aviation in the United States, including fire fighting aircraft, police, military, and general aviation as well as commercial aviation.
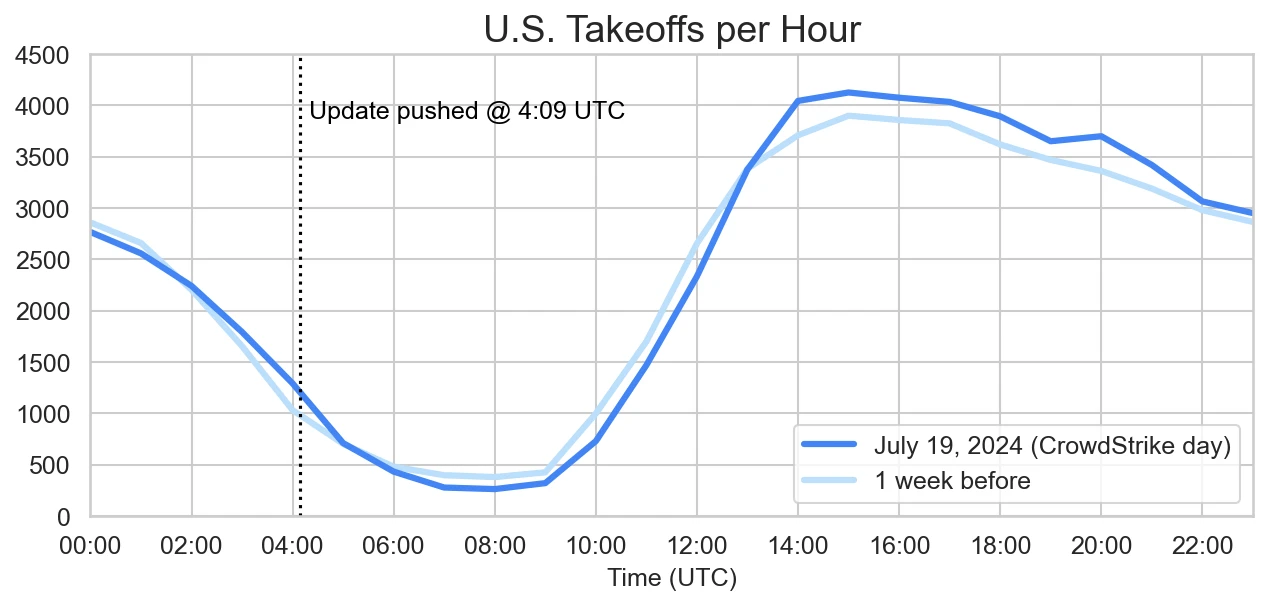
From about 0600 to 1300 there seems to have been a small decrease in the number of flights, and then a small increase in the rest of the day. Looking at the cumulative statistics starting from 0400, when the CrowdStrike update was pushed, flights were up 2.6% compared to the same period on the previous Friday.
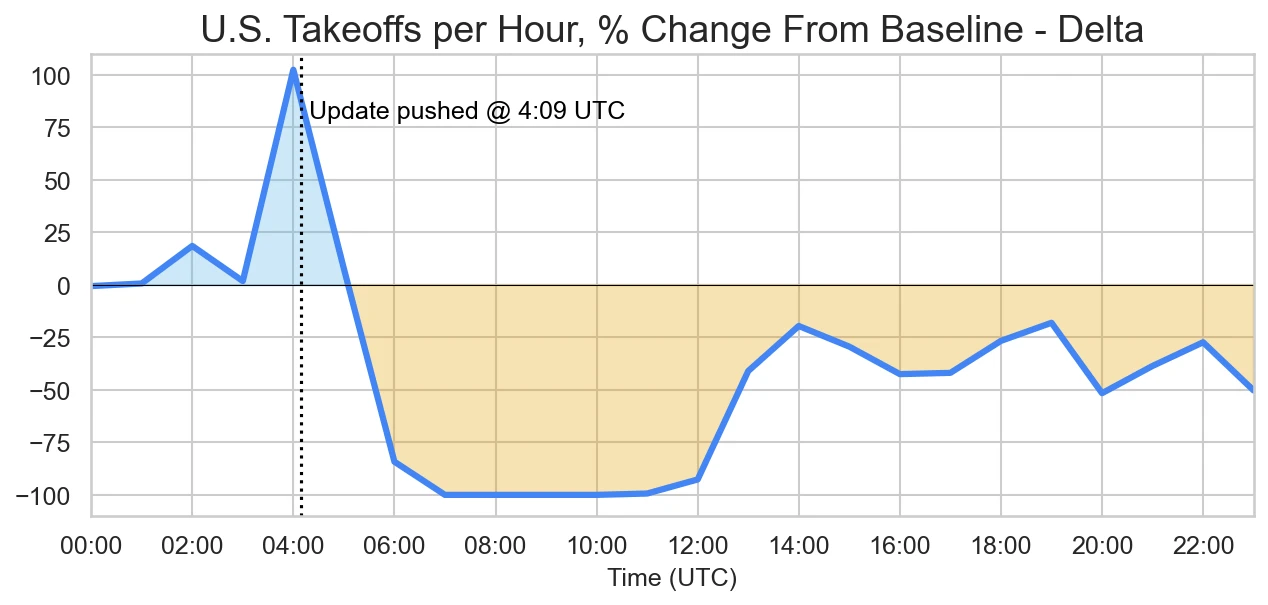
This chart shows the percentage change in flights, comparing each hour on July 19 to the matching hour of the previous Friday as the baseline:
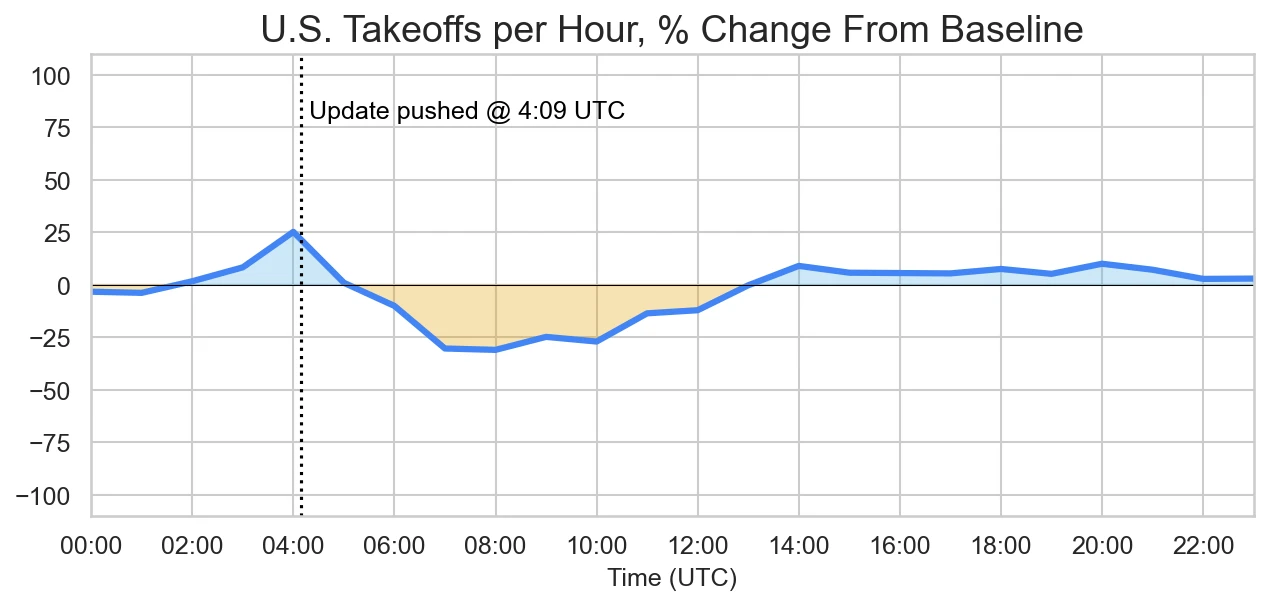
This chart brings CrowdStrike’s effects into greater relief. The hour with the largest percent decrease was from 0800 to 0900, which had only 261 flights compared to the previous Friday’s 378 flights, a 31% reduction.
Airline Statistics
Now let’s look at the statistics for the top 4 U.S. airlines: Delta, United, American, and Southwest.
Delta Air Lines
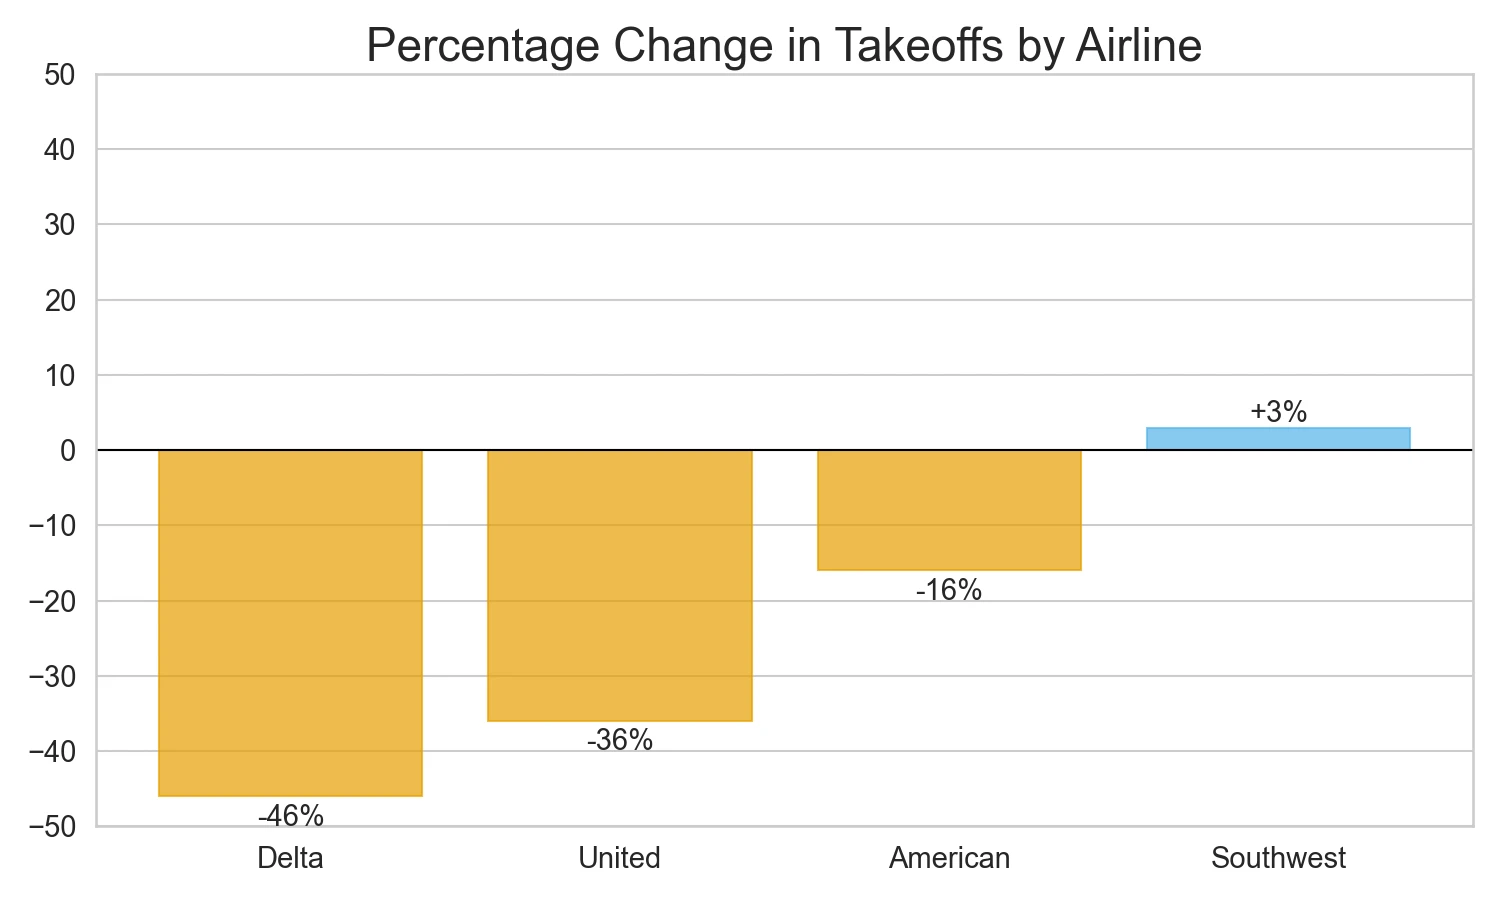
Change during CrowdStrike: -1087 flights (-46%)
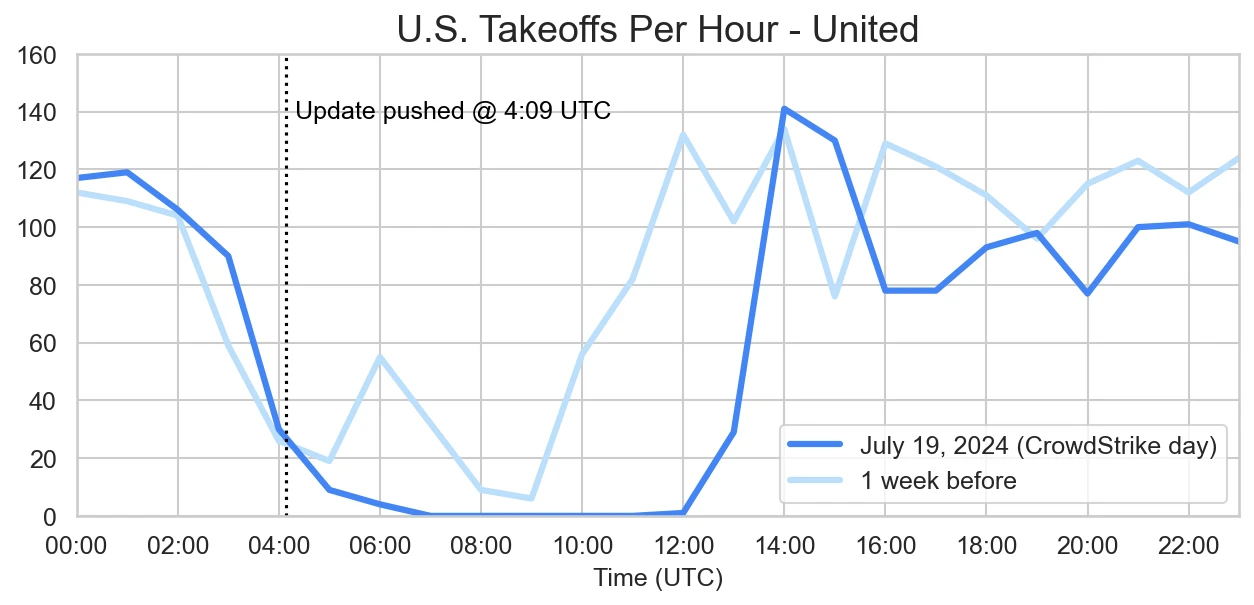
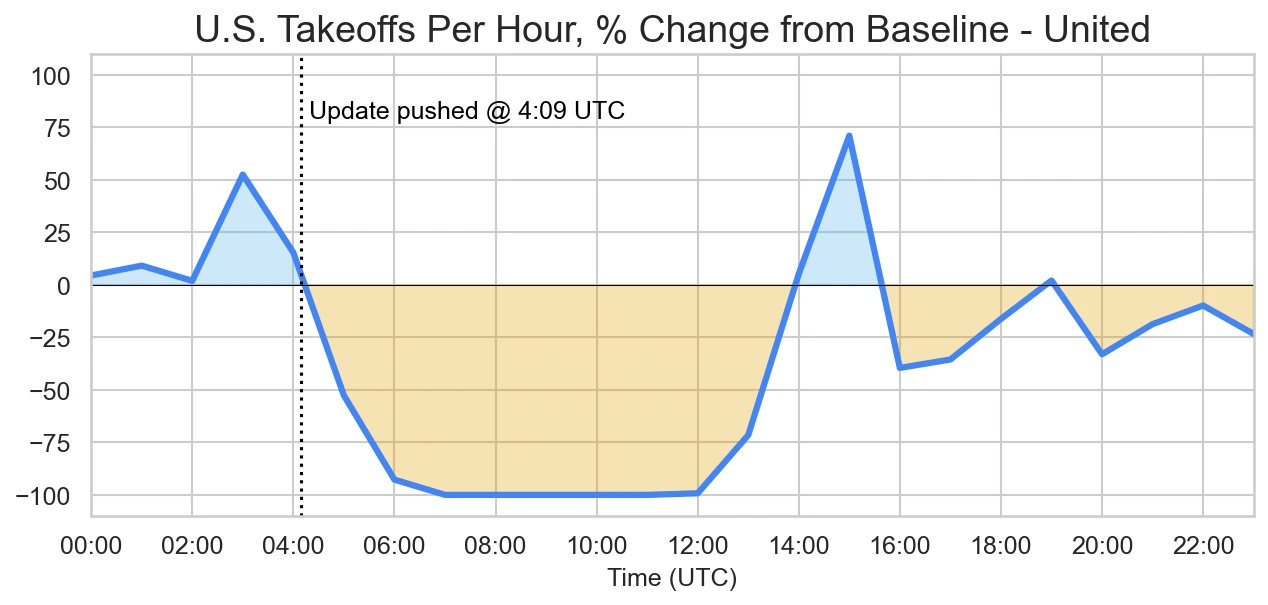
United Airlines
Change during CrowdStrike: -596 flights (-36%)
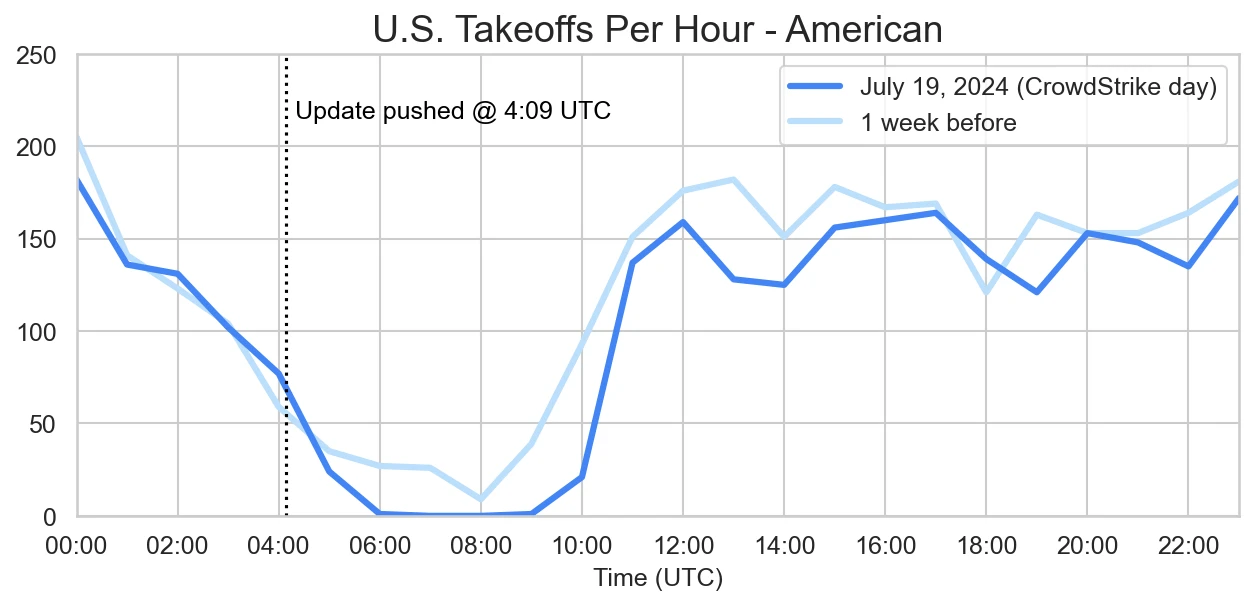
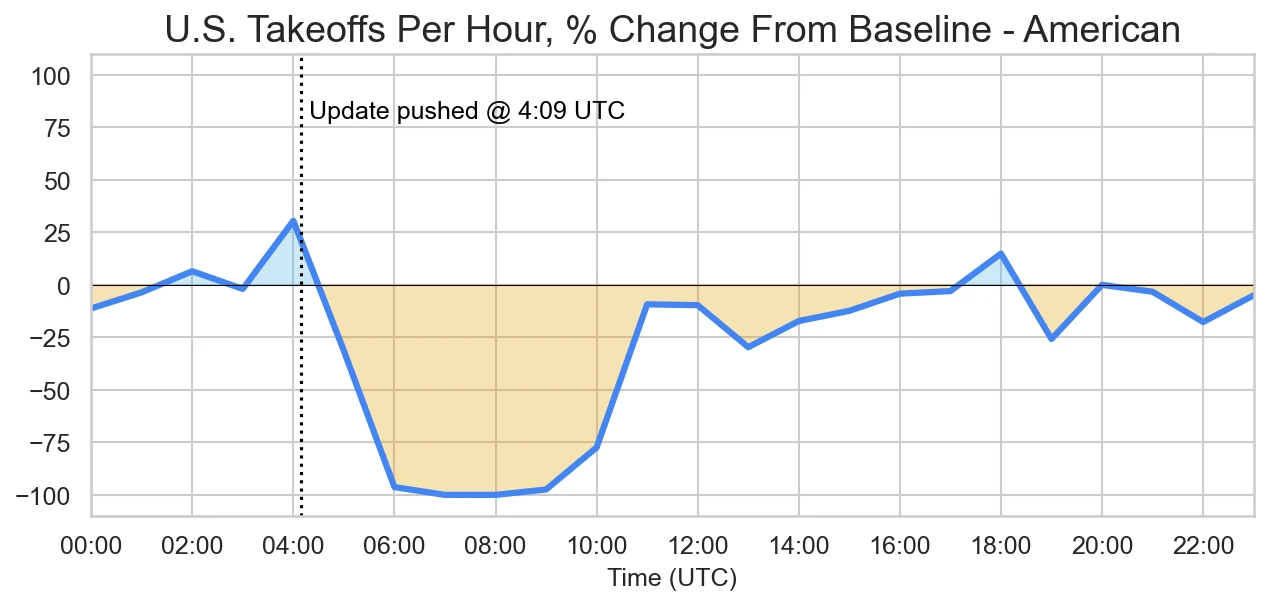
American Airlines
Change during CrowdStrike: -376 flights (-16%)
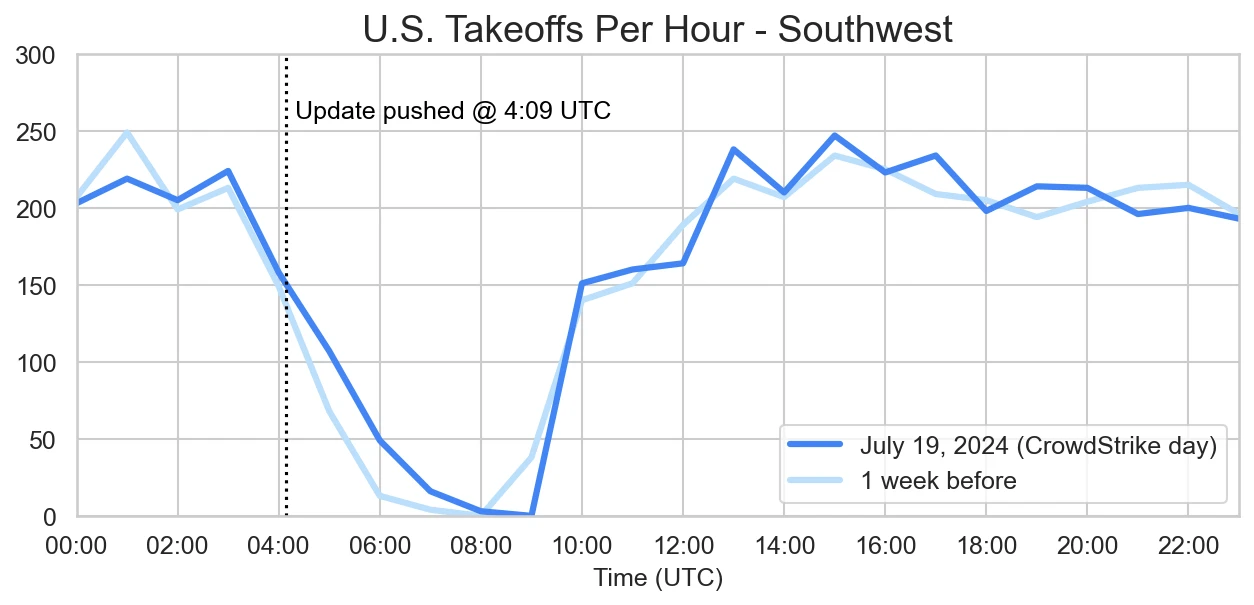
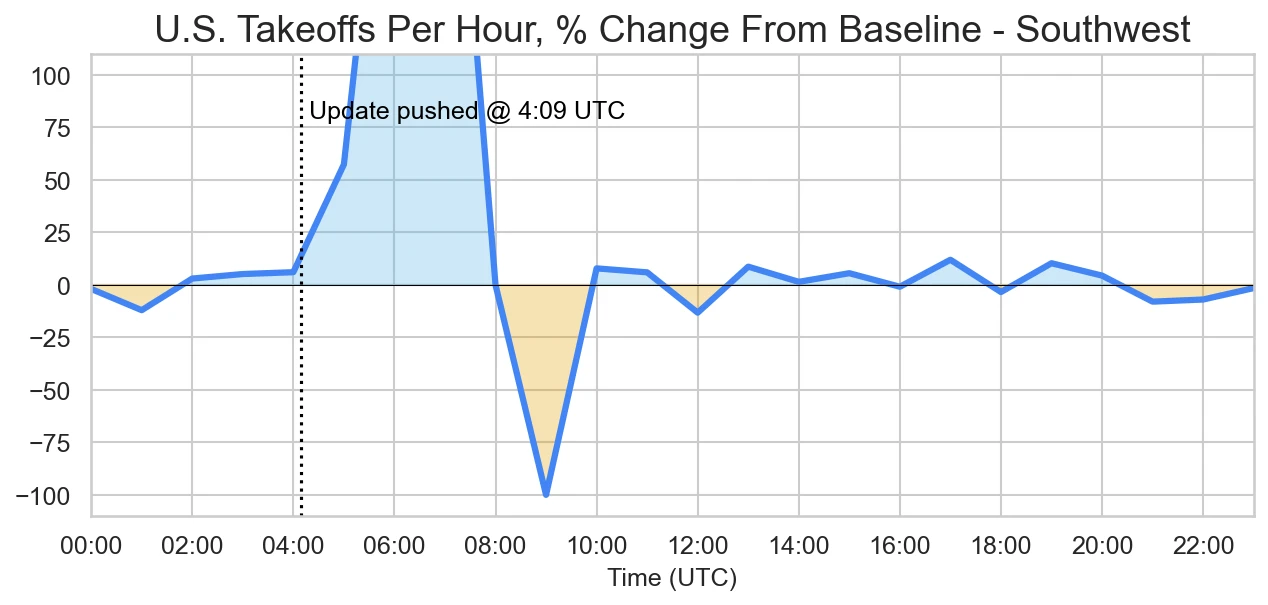
Southwest Airlines
Change during CrowdStrike: +101 flights (+3%)
Airlines Summary
Delta was hardest hit, then United, and to a significantly smaller degree American. Southwest didn’t seem to be affected at all.
Apparently Southwest Airlines’ ingenious strategy of never upgrading from Windows 3.1 allowed it to remain unscathed. This seems to be false, BTW. This ABC News article says that Southwest wasn’t affected because they don’t use CrowdStrike.]
Delta Air Lines took an extended time to recover, canceling thousands of flights in the days following the CrowdStrike update. Why were other airlines able to get back to normal so much faster than Delta? A terrible article from ABC News said this:
The reason for the prolonged recovery from the outage was because the CrowdStrike update disruption required a manual fix at each individual computer system, experts told ABC News. While each fix can be completed in no more than 10 minutes, the vast number of Delta’s digital terminals required significant manpower to address, expert said.
I’m reminded of sin #4 again–How is this different from any other airline? ABC News has no idea. A random redditor gave an unsourced explanation that might be wrong but at least attempts to answer the question “Why Delta so bad?” (DR = disaster recovery):
These “experts” are completely wrong. The core issue was Delta did NOT have a proper DR plan ready and did NOT have a proper IT business continuity plan ready. UA, AA, and F9 recovered so fast because they had plans on stand-by and engaged them immediately. After the SWA IT problem, UA and AA put in robust DR plans staged everywhere from the server farms, to cloud solutions, to end-user stations at airports. They had plans on how to recover systems. DL outsources a lot of their IT. UA and AA engaged those plans quickly. They did not hold back paying OT for staff. UA and AA have just as much reliance on Windows as Delta. AA was recovered by end of data Friday and resumed normal operations Saturday. UA was about 12 hours behind them having it resolved by Saturday morning resuming normal schedules Saturday afternoon. The ONUS is 100% on DL C+ level in their IT decisions.
Data and Analysis
I took raw ADS-B data from ADS-B Exchange and processed it through my custom code to detect aircraft takeoffs. I’m assuming that a takeoff is roughly equivalent to a flight, which isn’t actually true but is close enough for these purposes. It tends to undercount the number of aircraft flying, e.g. in the case where an aircraft took off from a field outside of ADS-B Exchange’s coverage, but it does so in a systematic way that still allows for valid comparisons between time periods. That is, the absolute numbers of flights may be too low, but the percent changes in numbers are accurate.
I counted takeoffs instead of counting flying aircraft because I already had code to detect takeoffs and didn’t want to write new code–this was just a quick weekend project.